
Company:
OFS
Year:
2025
Duration:
2 Months
Overview
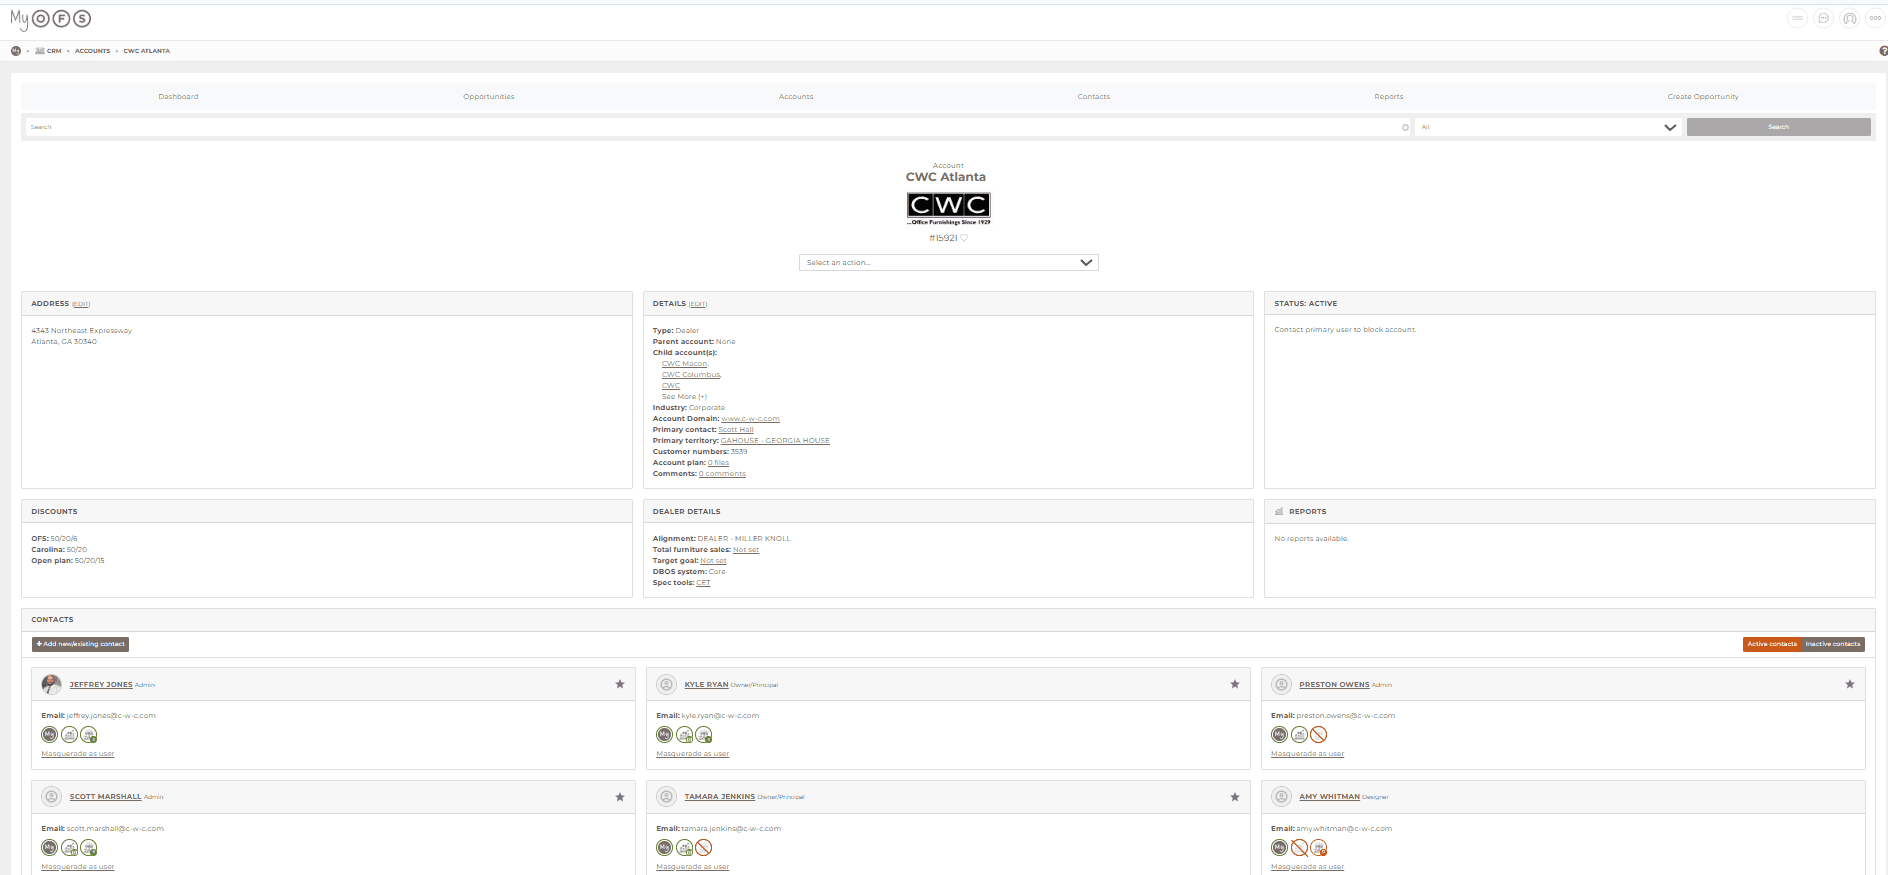
The Account Overview page in OFS’s internal CRM is a critical tool used daily by over 2,000 sales reps. The existing page was cluttered, visually flat, and required multiple scrolls to find basic account information, slowing workflow and meeting preparation. I redesigned the experience into a modern, scannable dashboard that surfaces key insights instantly, enabling sales reps to walk into meetings confident and prepared. 📊✨
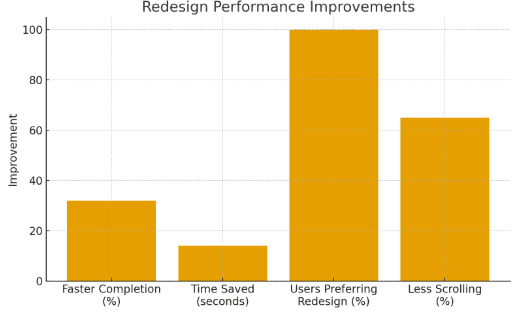
Usability testing showed task completion improved by 32% and scrolling decreased by 65%. 📈 The redesign has been approved and is rolling out company-wide, improving efficiency and user satisfaction. 🚀
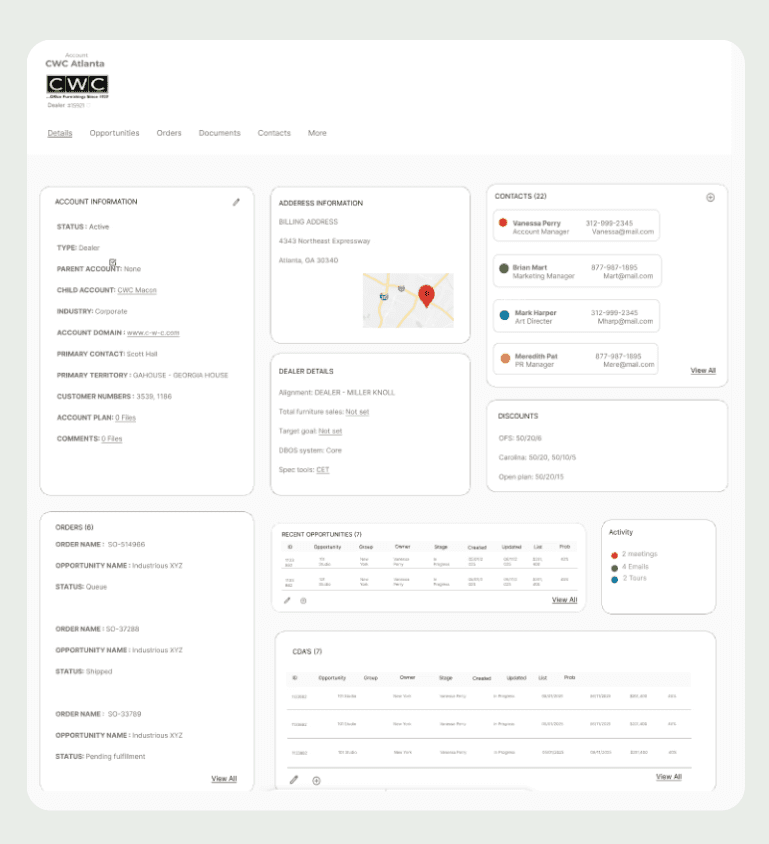
What Wasn’t Working
Early analysis revealed several foundational usability issues:
1. Dense, unstructured content
Long blocks of text, repetitive modules, and oversized contact lists created visual noise with little hierarchy to guide the eye.
2. Critical information buried below the fold
Key details like opportunities, account context, and upcoming events required multiple scrolls to find.
3. Lack of visual hierarchy
Content was presented in uniform gray containers, with no color cues, grouping, or clear prioritization.
4. Inefficient for meeting preparation
Sales reps often access this page immediately before calls. The existing layout slowed them down at the moment speed and clarity mattered most.
One sales rep summarized it well:
“It feels like the page is making me work for every piece of information.”
Below is the Account Overview section prior to the redesign.

Problem Statement❗
The original CRM layout slows sales reps down by hiding important details, creating unnecessary scrolling, and increasing cognitive load
Research Phase 🔍
To deeply understand the problem, I used a multi-method research approach. Each method uncovered insights into real sales workflows, priorities, and time constraints.
Stakeholder Interviews 🤝
Contextual Inquiry 👀
Heuristic Evaluation 🧠
Competitive Analysis 📊
Pattern Analysis 🧩
Persona Development 👤
01 — Stakeholder Interviews 🤝
I interviewed:
2 Sales Representatives
2 Technology Team Members
Key insights
Sales reps want a quick snapshot, not a deep dive.
The page is checked rapidly, so scanability is critical.
An oversized contact list pushed important information below the fold.
Salesforce served as a strong reference for effective structure and visual hierarchy.
These interviews established clear expectations and directly informed the goals of the redesign.
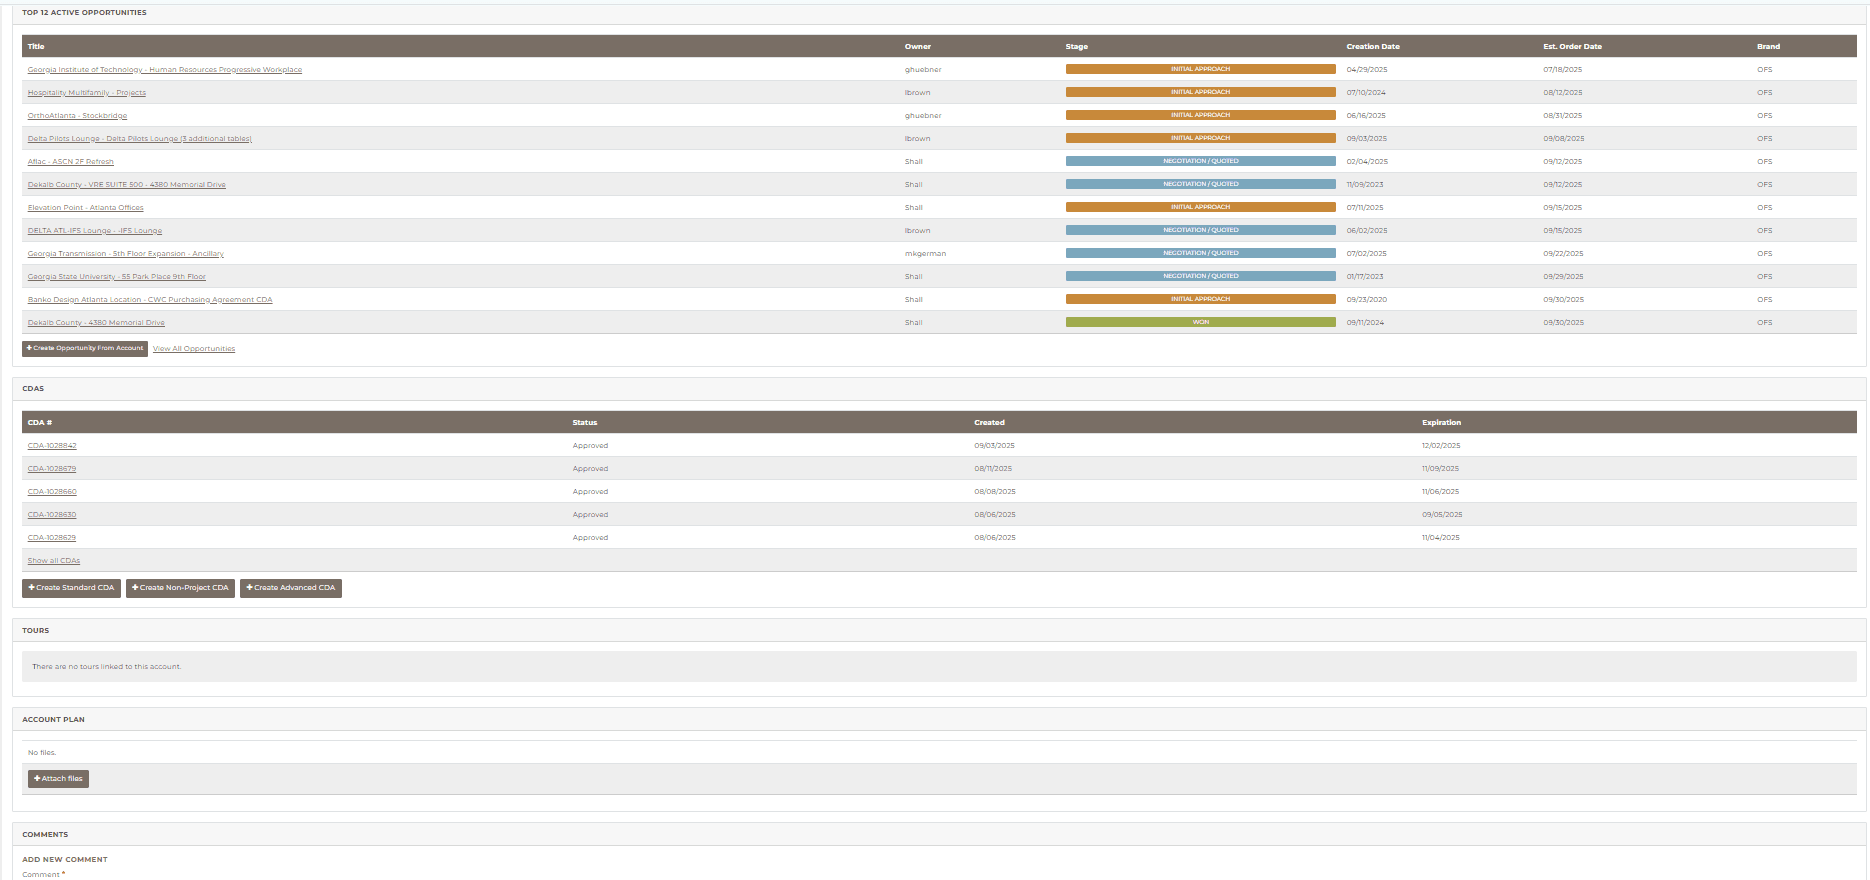
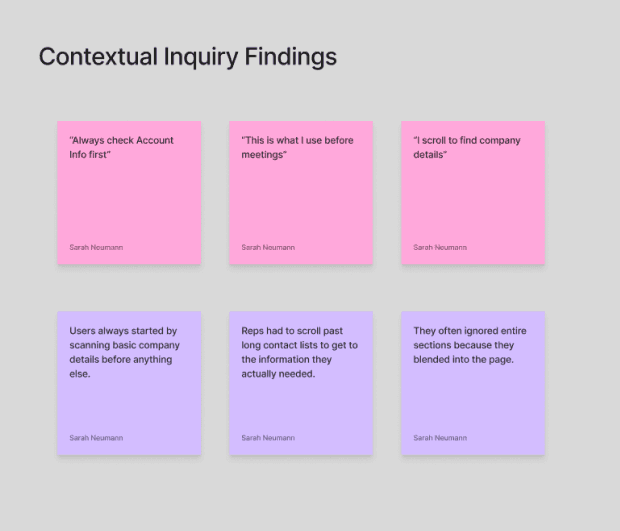
02 — Contextual Inquiry👀
To understand real behavior, I observed reps using the current CRM.
What I observed
Reps skimmed content, they never read long text blocks.
They typically looked at account details first.
Contact lists were rarely needed, yet they dominated over a page.
Frequent overscrolling indicated poor visual anchors.
The page structure did not match the rep’s mental model.
This was a turning point: the existing layout contradicted the natural way reps approached an account.
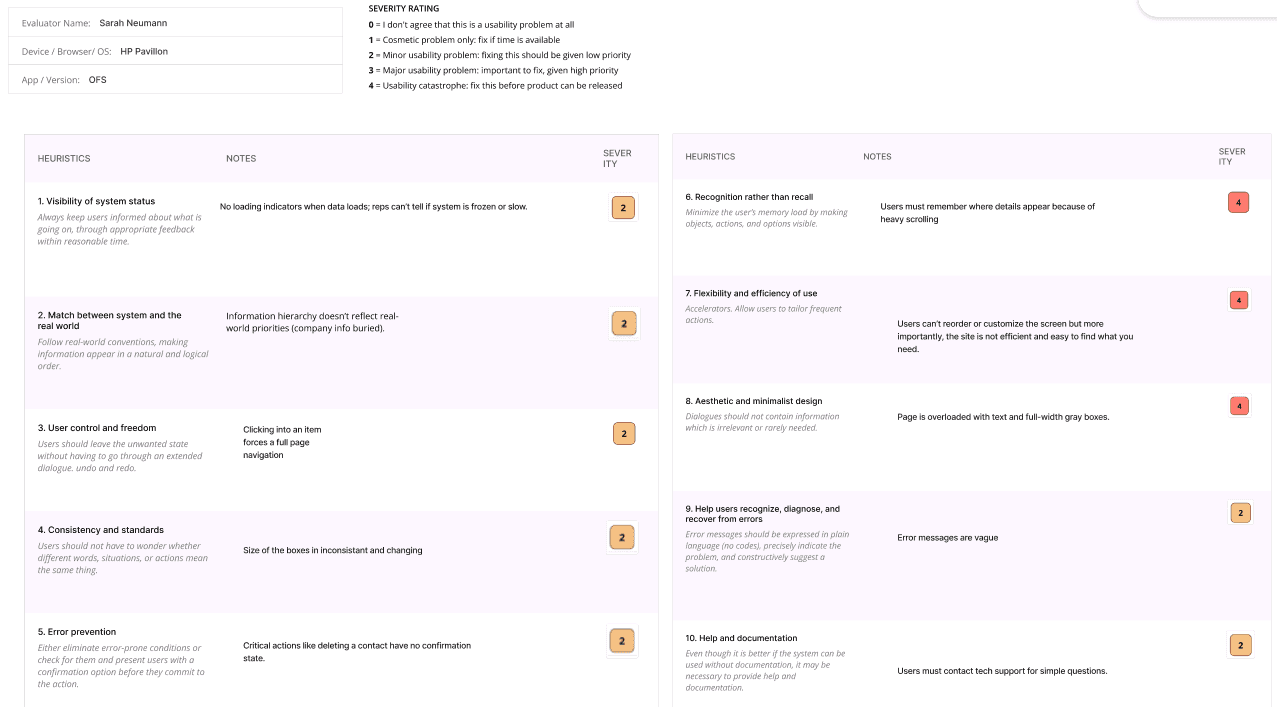
03 — Heuristic Evaluation🧠
I evaluated the existing CRM using Nielsen’s 10 heuristics.
Major violations
Visibility of system status
Nothing visually communicated importance or status.
Recognition over recall
Users had to remember which sections lived where because nothing stood out.
Aesthetic and minimalist design
Everything was equally heavy and crowded; no prioritization.
Flexibility and efficiency of use
Scrolling was the only navigation method.
This evaluation gave me a clear diagnostic report on structural issues I needed to fix.
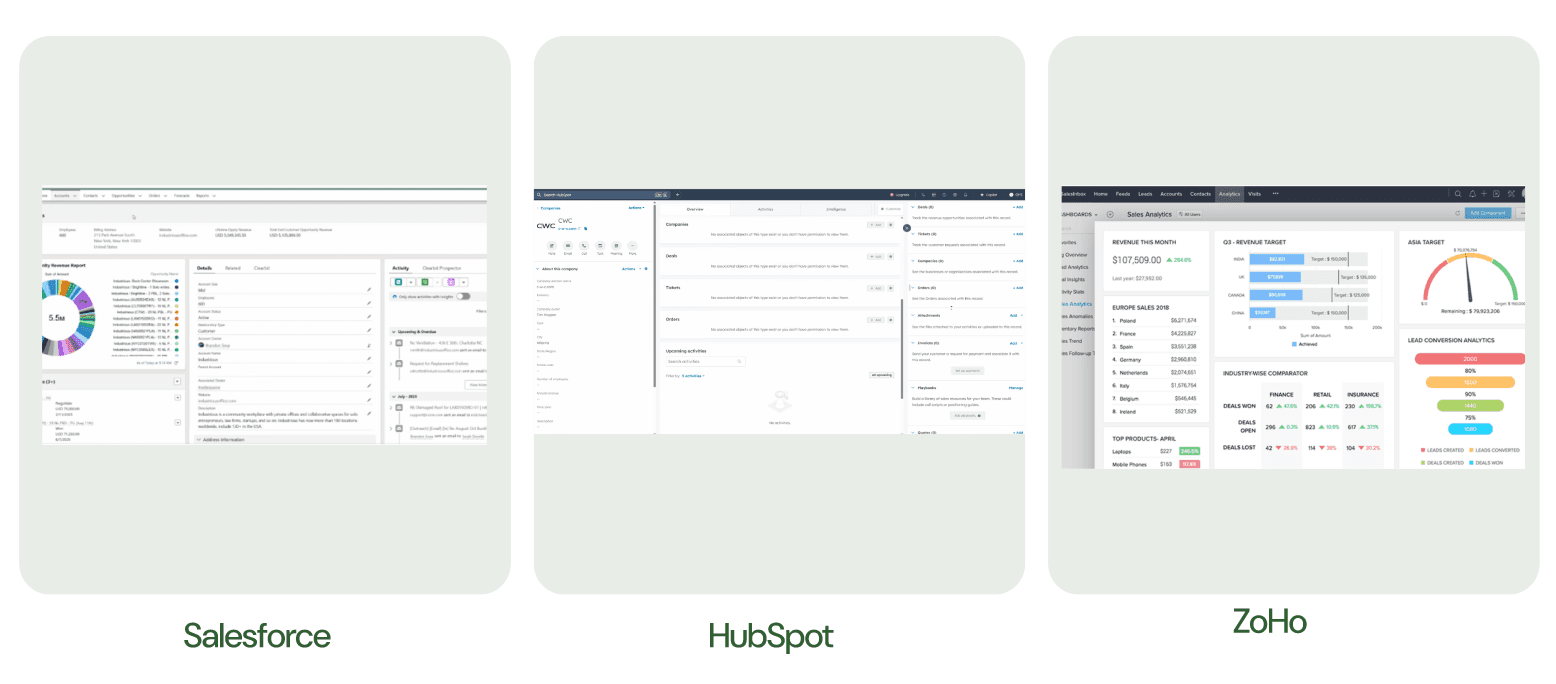
04 — Competitive Analysis (Salesforce, HubSpot, Zoho)🔍
I studied how leading CRMs solve similar problems, focusing on:
Snapshot vs. detail structures
Card based layouts
Chart styles
Above-the-fold prioritization
Navigation systems
Hierarchy and whitespace usage
Patterns I extracted
Card layouts reduce cognitive load
Charts + color cues help users retain information faster
Navigation bars prevent over-scrolling
Summary-first → detail-second is the gold standard for dashboards
I didn't copy these systems — I adapted the underlying principles to OFS’s unique context.
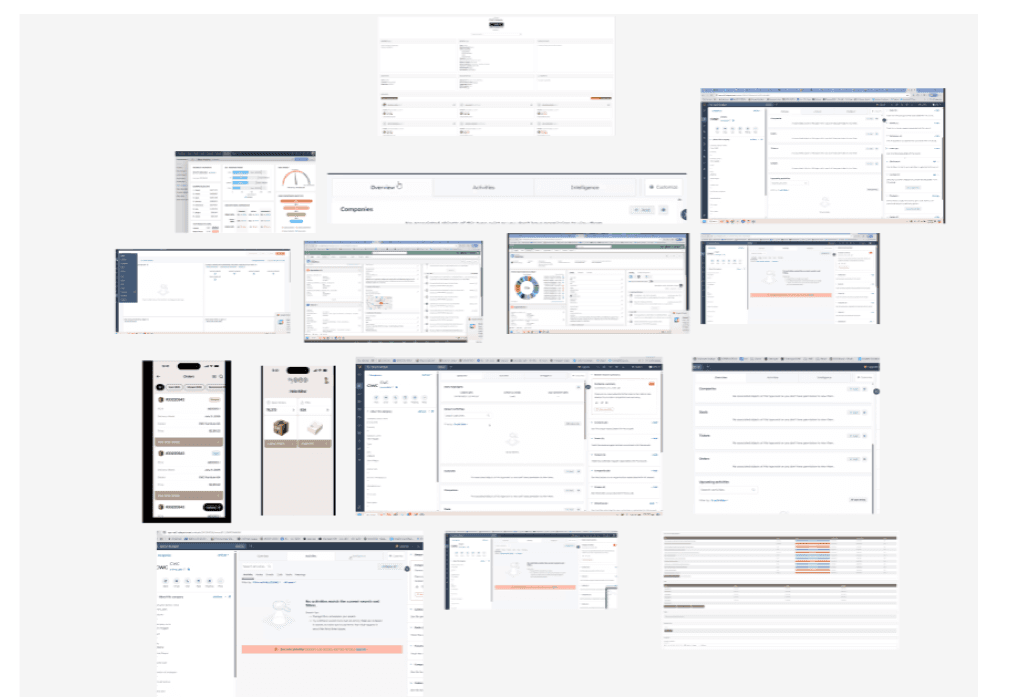
05 — Pattern Analysis Across Dashboards🧩
Next, I examined modern analytics platforms and dashboards for:
Scanning behavior
Spacing systems
Grid structures
Visual weight
Information grouping
This informed my layout decisions, ensuring content felt organized and digestible.
06 — Persona Development👤
I synthesized the research into a persona I called:
“The Fast-Moving Sales Rep”
Profile:
Busy, often multitasking, preparing for multiple meetings a day.
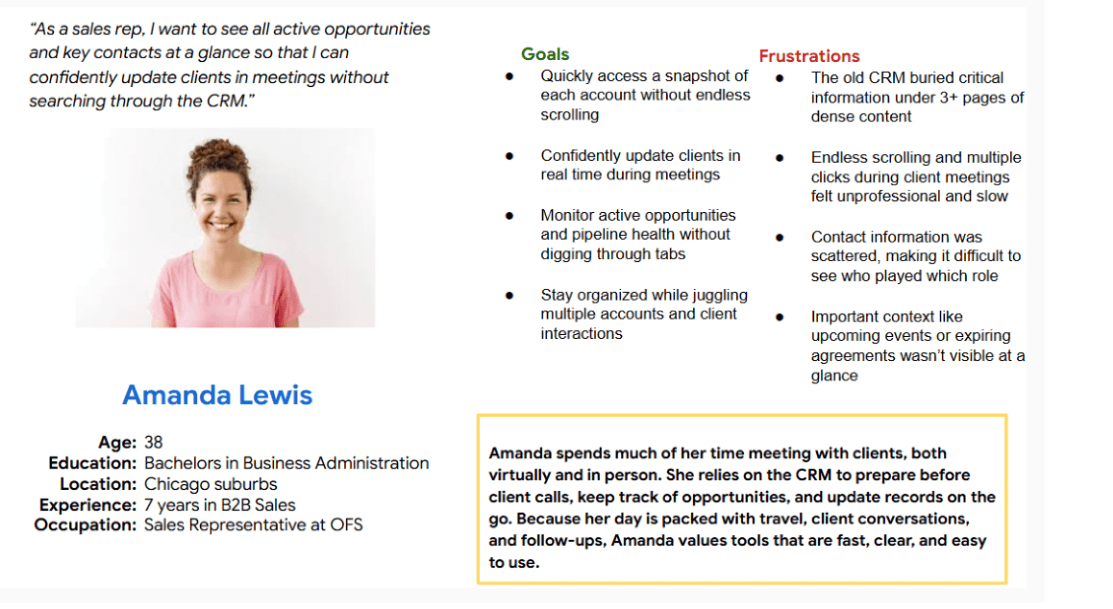
The persona became my decision-making anchor throughout the redesign.
Synthesizing my research🔗
After collecting all data, I mapped it into themes:
Pain Points
No hierarchy
Excessive scrolling
Lack of visual cues
Contact lists too long
User Needs
Quick understanding of account
Predictable structure
Modern visual cues
Clear separation of content
Opportunities
Introduce a structured card system
Add top navigation to reduce scroll reliance
Use colors and charts to show trends
Convert long text into visual summaries
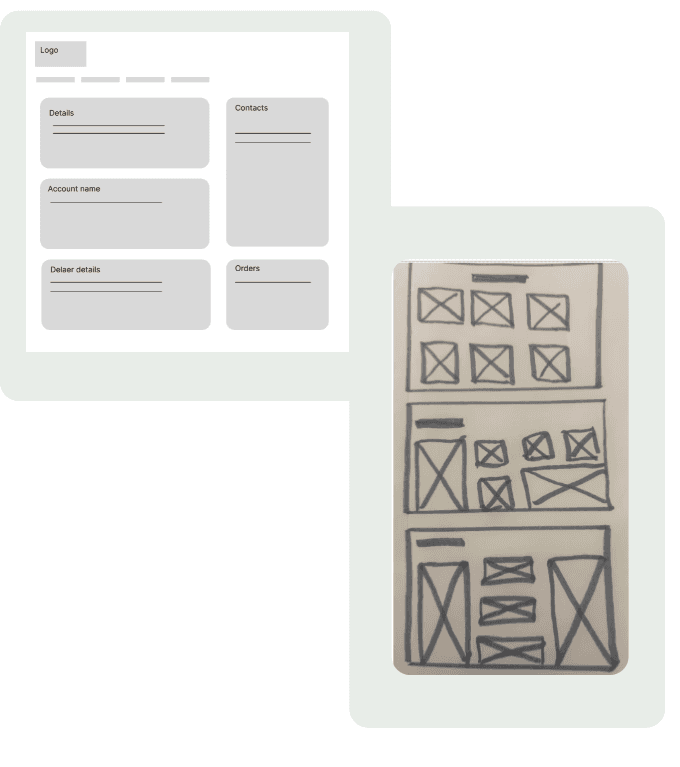
Starting the design🎨✨
Low-fidelity Wireframes✏️📐
Mid-fidelity wireframes🖊️📊
I then refined brought my ideas to life with Figma paying close attention to:
Spacing
Grouping
Card boundaries
Navigation bar placement
The balance between snapshot vs. detail
Contact list condensation
Chart placeholders
This stage focused on structure, not visuals, allowing stakeholders to respond to layout choices objectively.
Collaboration and Feedback on the Mid-Fi🤝
Sales rep (senior)
Requested Events card
Wanted pipeline to be more visual
Confirmed they rarely needed individual contact names
Tech team
Encouraged charts/icons
Needed patterns that could scale to other modules
Preferred short summaries over long text blocks
This feedback shaped the next iteration.
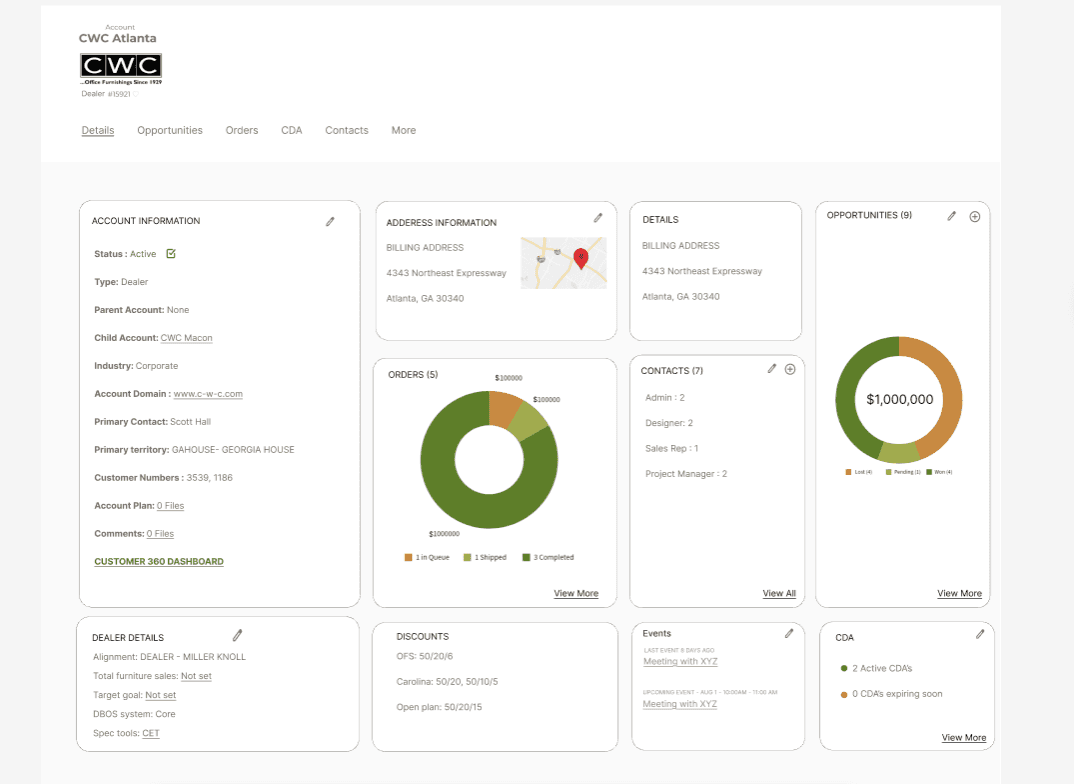
Major Improvements✨
📊 Added charts for opportunities & orders
👥 Condensed contacts further into role based summaries
📅 Added Events card for upcoming meetings
🎨 Shortened and color-coded CDA renewal statuses
🔗 Added Customer 360 quick link
📉 Reduced page length from 3+ pages to one dashboard
⏱ Reworked activity feed with time based grouping (ex: last 30 days)
Every change addressed a real, research backed pain point.
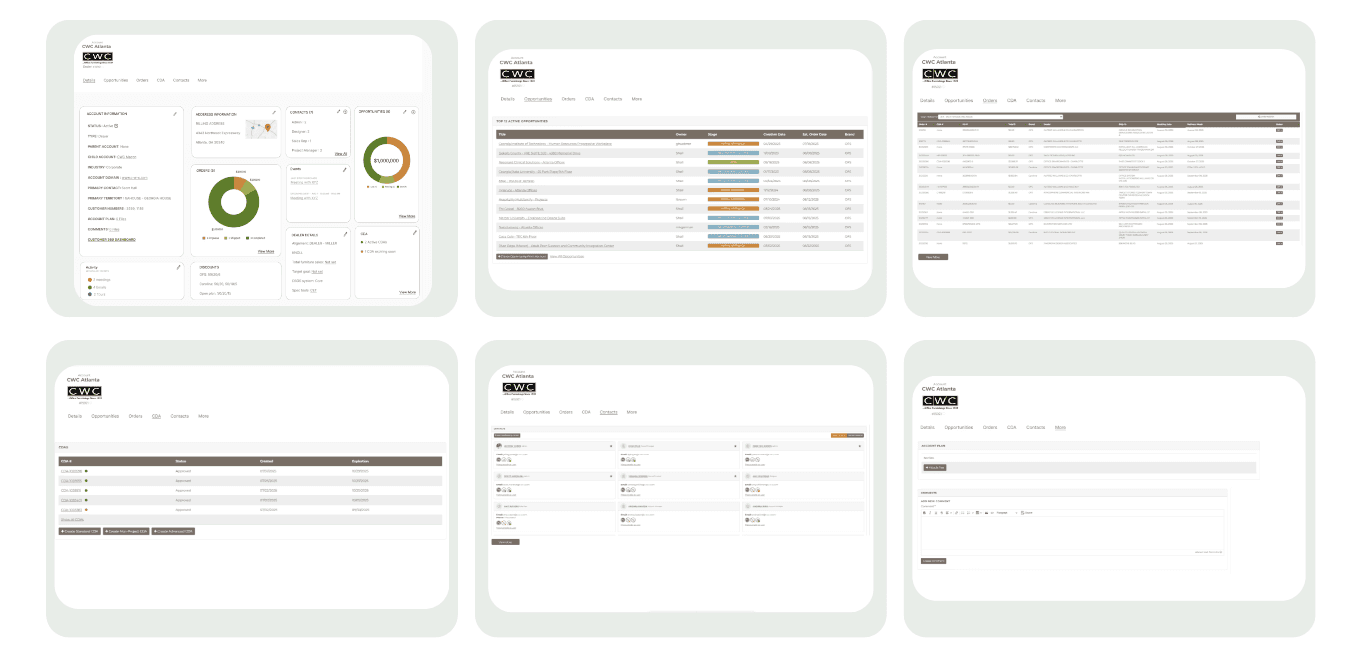
System expansion⚙️
Built a Consistent Structure for Deeper Detail Pages
After finalizing the main Account Overview dashboard, the next phase was scaling the system across all the secondary pages that users access when they click “View More” on any card. This included pages for Opportunities, CDA Agreements, Contacts, Activity, Orders, and Reports.
Final Design🎨✨
Before
Long, dense blocks of text
Repetitive gray modules
No visual hierarchy
No charts or color cues
3+ pages of scrolling
After
Clean, scannable dashboard
High clarity card system
Visual charts + summaries
Color coded indicators
One page structure
Fast prep layout
Consistent spacing and modular patterns
The difference is a shift from information dumping → insight delivery.
Usability testing🖥️
Participants
4 users unfamiliar with OFS CRM who were not told which design was the redesigned version.
Tasks
Find company address
Check for expiring agreements
Find specific opportunities
Locate specific contacts
Results
32% faster task completion
Scrolling reduced by 65%
4/4 participants preferred the redesign
Described it as:
“much clearer”
“more professional”
“way easier to scan”
The redesign delivered measurable improvements in both speed and comprehension.
Impact📈⚡
Design approved & rolled out to 2,000+ sales reps
Card based design system adopted across three additional CRM modules
Faster meeting prep for sales reps
Less frustration, less cognitive load
A modern internal tool that supports business efficiency
Challenges🚧⚡
1. Backend constraints
I couldn’t restructure the database, so I designed around existing data fields while still improving clarity.
2. Legacy expectations
Some users were attached to old patterns. I justified changes with data, usability findings, and simple prototypes that clearly demonstrated the improvements.
Accessibility♿🛠️
Increased color contrast for key statuses
Clear, descriptive labels for charts
Reduced jargon
Improved spacing & whitespace
Consistent patterns for scanning
Clear visual grouping to reduce cognitive load
My Contributions👩💻🤝
I owned the project end-to-end, including:
Research planning
Stakeholder interviews
Contextual inquiry
Heuristic evaluation
Competitive analysis
Persona development
Information architecture
Wireframes & mid-fi mocks
High-fidelity design
Prototyping
Usability testing
Iterations and final delivery
Cross functional communication
Future Roadmap🚀🔮
Personalized dashboards (pinning & collapsing cards)
Mobile friendly for on the go
AI-driven quick summary
Reflection💭🧠
This project sharpened my ability to:
Translate user needs into structural design decisions
Synthesize research into clear direction
Simplify complex data environments
Design scalable systems
Work cross-functionally with non-design teams
Deliver measurable impact
It reinforced why I love enterprise UX:
I enjoy simplifying complexity to make people’s daily work feel lighter, faster, and more intuitive.


